Homicide Rates in New York vs Los Angeles (2010–2020): Crime Trends and Urban Safety
Introduction
Assessing crime, especially homicides, provides valuable insights into the degree of safety and security within a society. Homicides are considered indicator crimes because of their severity and social impact. To assess the effectiveness of public safety campaigns, manage funding effectively, and implement preventative measures, people, lawmakers, and law enforcement organizations need to be well-versed in homicide data. Reliable data collection and reporting are necessary for a true assessment of crime in any location, despite the challenges of accounting for every incident due to underreporting and incorrect classification.
NYC and LA Context
Two of the biggest cities in the US, New York City and Los Angeles, have advanced systems for gathering and reporting crime statistics. These localities create thorough crime statistics using information from victim questionnaires, police records, and other sources. There are specialized units for crime analysis in both the Los Angeles Police Department (LAPD) and the New York Police Department (NYPD). These divisions collaborate with federal agencies to ensure data accuracy and compliance with the FBI’s Uniform Crime Reporting (UCR) guidelines.
Changes in Crime During the Identified Period
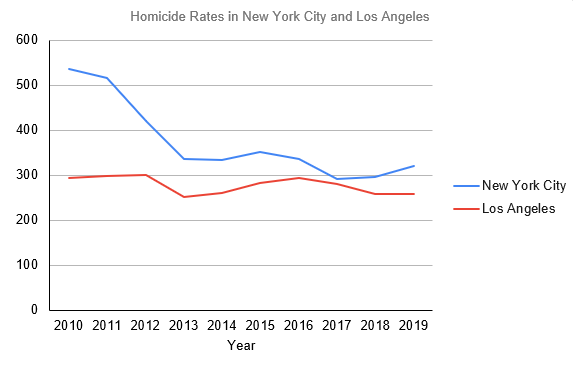
From 2010 to 2020, New York City and Los Angeles experienced varied crime trends. In New York City, the homicide incidents ranged from 292 to 536, with a notable decrease of approximately 12.69% from the beginning to the end of the decade, despite a 46.71% increase in the final year compared to the previous one (Trend of Violent Crime, n.d.). The mean homicide count was 382 with a median of 335. Conversely, Los Angeles saw its homicide rate increase from 251 to 351, with an overall 19.80% increase across the decade and a significant 36.05% increase in the last year (The Associated Press, 2016; The Associated Press, 2003). The mean for LA was 284 incidents with a median of 282, indicating a rising trend in the latter part of the decade.
Data Visualization Context
The dynamic nature of urban crime is illustrated by the graph showing crime rates in New York City and Los Angeles from 2010 to 2020. By emphasizing the years with significant rises or falls in homicide rates, it offers a graphic representation of the historical shifts. Understanding the efficacy of the crime-prevention and response tactics used by both cities is easier with this depiction.
Measurability of Homicides
Even though homicide rates are among the offenses that are most properly recorded, there may be problems with measuring them. Discrepancies can be caused by a variety of factors, including variations in reporting procedures, differences in death classification, and the possibility of undetected crimes (Beirne & Messerschmidt, 2011). Nonetheless, because killings are such serious crimes, people report them with great care, providing as much information as they can within the admitted limitations.
Comparison to Media Reports
The summary statistics and the broader context from the provided information suggest a nuanced picture of crime trends in Los Angeles. While media pieces indicate periods of crime increases, our decade-long data analysis also captures these fluctuations, offering both confirmation and a broader perspective on the dynamics of crime rates (The Associated Press, 2016). The comparative approach underlines the importance of long-term data analysis in understanding crime trends.
Generalizations
The analysis of homicide rates from various sources underscores the complexity of crime dynamics in major cities. This shows that while New York City and Los Angeles face challenges in managing homicides, there are periods of success in crime reduction attributable to targeted law enforcement and community intervention programs. Crime trends are not linear but influenced by an array of social, economic, and political factors. This complexity suggests that effective crime reduction strategies need to be adaptive, multifaceted, and sustained over time, incorporating community engagement, socioeconomic development, and proactive policing to address the root causes of crime and ensure lasting improvements in public safety.
Conclusion
In deciding between relocating to New York City or Los Angeles, the broader analysis of crime trends suggests a preference for New York City. This preference is informed by the observed general downward trend in NYC’s crime rates over the assessed period, which contrasts with the more varied crime trends in Los Angeles. Despite an uptick in 2020, New York City’s overall decrease in crime rates suggests that its public safety and crime-prevention efforts have been relatively effective.
This analysis does not disregard the complexities of urban crime or the potential for future fluctuations. Still, the data indicate a statistical edge in safety for New York City. The decision, influenced by quantitative analysis, also considers qualitative aspects of urban living, such as community resilience and policy responsiveness, which are crucial in choosing a place to live.
References
Beirne, P., & Messerschmidt, W. J. (2011). Criminology: A social approach (5th ed). Oxford University Press.
The Associated Press. (2016). California: Los Angeles Reports Increases in Crime. The New York Times.
The Associated Press. (2003). Homicides and Other Crimes Are on the Rise in California. The New York Times.
Trend of Violent Crime. (n.d.) Crime Data Explorer.
